BYOC Observability
BYOC deployments include comprehensive observability capabilities, allowing you to monitor your ClickHouse services through a dedicated Prometheus monitoring stack, and direct metric endpoints from ClickHouse Servers. All observability data remains within your cloud account, giving you complete control over your monitoring infrastructure.
Prometheus Monitoring Approaches
BYOC offers two main ways to collect and visualize metrics using Prometheus:
- Connect to the Built-In Prometheus Stack: Access the centralized, pre-installed Prometheus instance running inside your BYOC Kubernetes cluster.
- Scrape ClickHouse Metrics Directly: Point your own Prometheus deployment to the
/metrics_allendpoint exposed by each ClickHouse service.
Comparing Monitoring Methods
| Capability | Built-In Prometheus Stack | Direct Scraping from ClickHouse Services |
|---|---|---|
| Metrics Scope | Consolidates metrics from ClickHouse, Kubernetes, and supporting services (full cluster visibility) | Metrics from individual ClickHouse servers only |
| Setup Process | Requires setting up private network access (e.g., via private load balancer) | Simply configure Prometheus to scrape the public or private ClickHouse endpoint |
| How You Connect | Through the private load balancer within your VPC/network | The same endpoint you use for database access |
| Authentication | None needed (private-network-restricted) | Uses ClickHouse service credentials |
| Network Prerequisites | Private load balancer and appropriate network connectivity | Available to any network with access to your ClickHouse endpoint |
| Best Suited For | Holistic infrastructure & service monitoring | Service-specific monitoring and integration |
| How to Integrate | Configure federation in external Prometheus to ingest cluster metrics | Add ClickHouse metric endpoints directly to your Prometheus config |
Recommendation: For most use cases, we recommend integrating with the built-in Prometheus stack, as it provides comprehensive metrics from all components in your BYOC deployment (ClickHouse services, Kubernetes cluster, and supporting services) rather than just ClickHouse server metrics alone.
The Built-in BYOC Prometheus Stack
ClickHouse BYOC deploys a complete Prometheus monitoring stack within your Kubernetes cluster, including Prometheus, Grafana, AlertManager, and optionally Thanos for long-term metric storage. This stack collects metrics from:
- ClickHouse servers and ClickHouse Keeper
- Kubernetes cluster and system components
- Underlying infrastructure nodes
Accessing the Prometheus Stack
To connect to the built-in Prometheus stack:
- Contact ClickHouse Support to enable the private load balancer for your BYOC environment.
- Request the Prometheus endpoint URL from ClickHouse Support.
- Verify private network connectivity to the Prometheus endpoint—typically via VPC peering or other private network setup.
The Prometheus endpoint will be in the following format:
The Prometheus stack URL is only accessible via private network connections and does not require authentication. Access is restricted to networks that can reach your BYOC VPC through VPC peering or other private connectivity options.
Integrating with Your Monitoring Tools
You can utilize the BYOC Prometheus stack in your monitoring ecosystem in several ways:
Option 1: Query the Prometheus API
- Access the Prometheus API endpoint directly from your preferred monitoring platform or custom dashboards.
- Use PromQL queries to extract, aggregate, and visualize the metrics you need.
- Ideal for building bespoke dashboards or alerting pipelines.
Prometheus query endpoint:
Option 2: Federate Metrics to Your Own Prometheus
- Configure your external Prometheus instance to federate (pull) metrics from the ClickHouse BYOC Prometheus stack.
- This enables you to unify and centralize metrics collection from multiple environments or clusters.
- Example Prometheus federation configuration:
ClickHouse service Prometheus Integration
ClickHouse services expose a Prometheus-compatible metrics endpoint that you can scrape directly using your own Prometheus instance. This approach provides ClickHouse-specific metrics but does not include Kubernetes or supporting service metrics.
Accessing the Metrics Endpoint
The metrics endpoint is available at /metrics_all on your ClickHouse service endpoint:
Sample Response:
Authentication
The metrics endpoint requires authentication using ClickHouse credentials. We recommend use default user or creating a dedicated user with minimal permissions specifically for metric scraping.
Required Permissions:
REMOTEpermission to connect to the serviceSELECTpermissions on relevant system tables
Example User Setup:
Configuring Prometheus
Configure your Prometheus instance to scrape the ClickHouse metrics endpoint:
Replace:
<service-subdomain>.<byoc-subdomain>.<region>.<provider>.byoc.clickhouse-byoc.com:8443with your actual service endpoint<username>and<password>with your scraping user credentials
ClickHouse Mixin
For teams that want a ready-made set of dashboards, ClickHouse provides a Prometheus ClickHouse Mixin. This is a pre-built Grafana dashboard designed specifically for monitoring ClickHouse clusters.
Setting up Grafana & Importing the ClickHouse Mix-in
Once your Prometheus instance is integrated with your ClickHouse monitoring stack, you can visualize metrics in Grafana by following these steps:
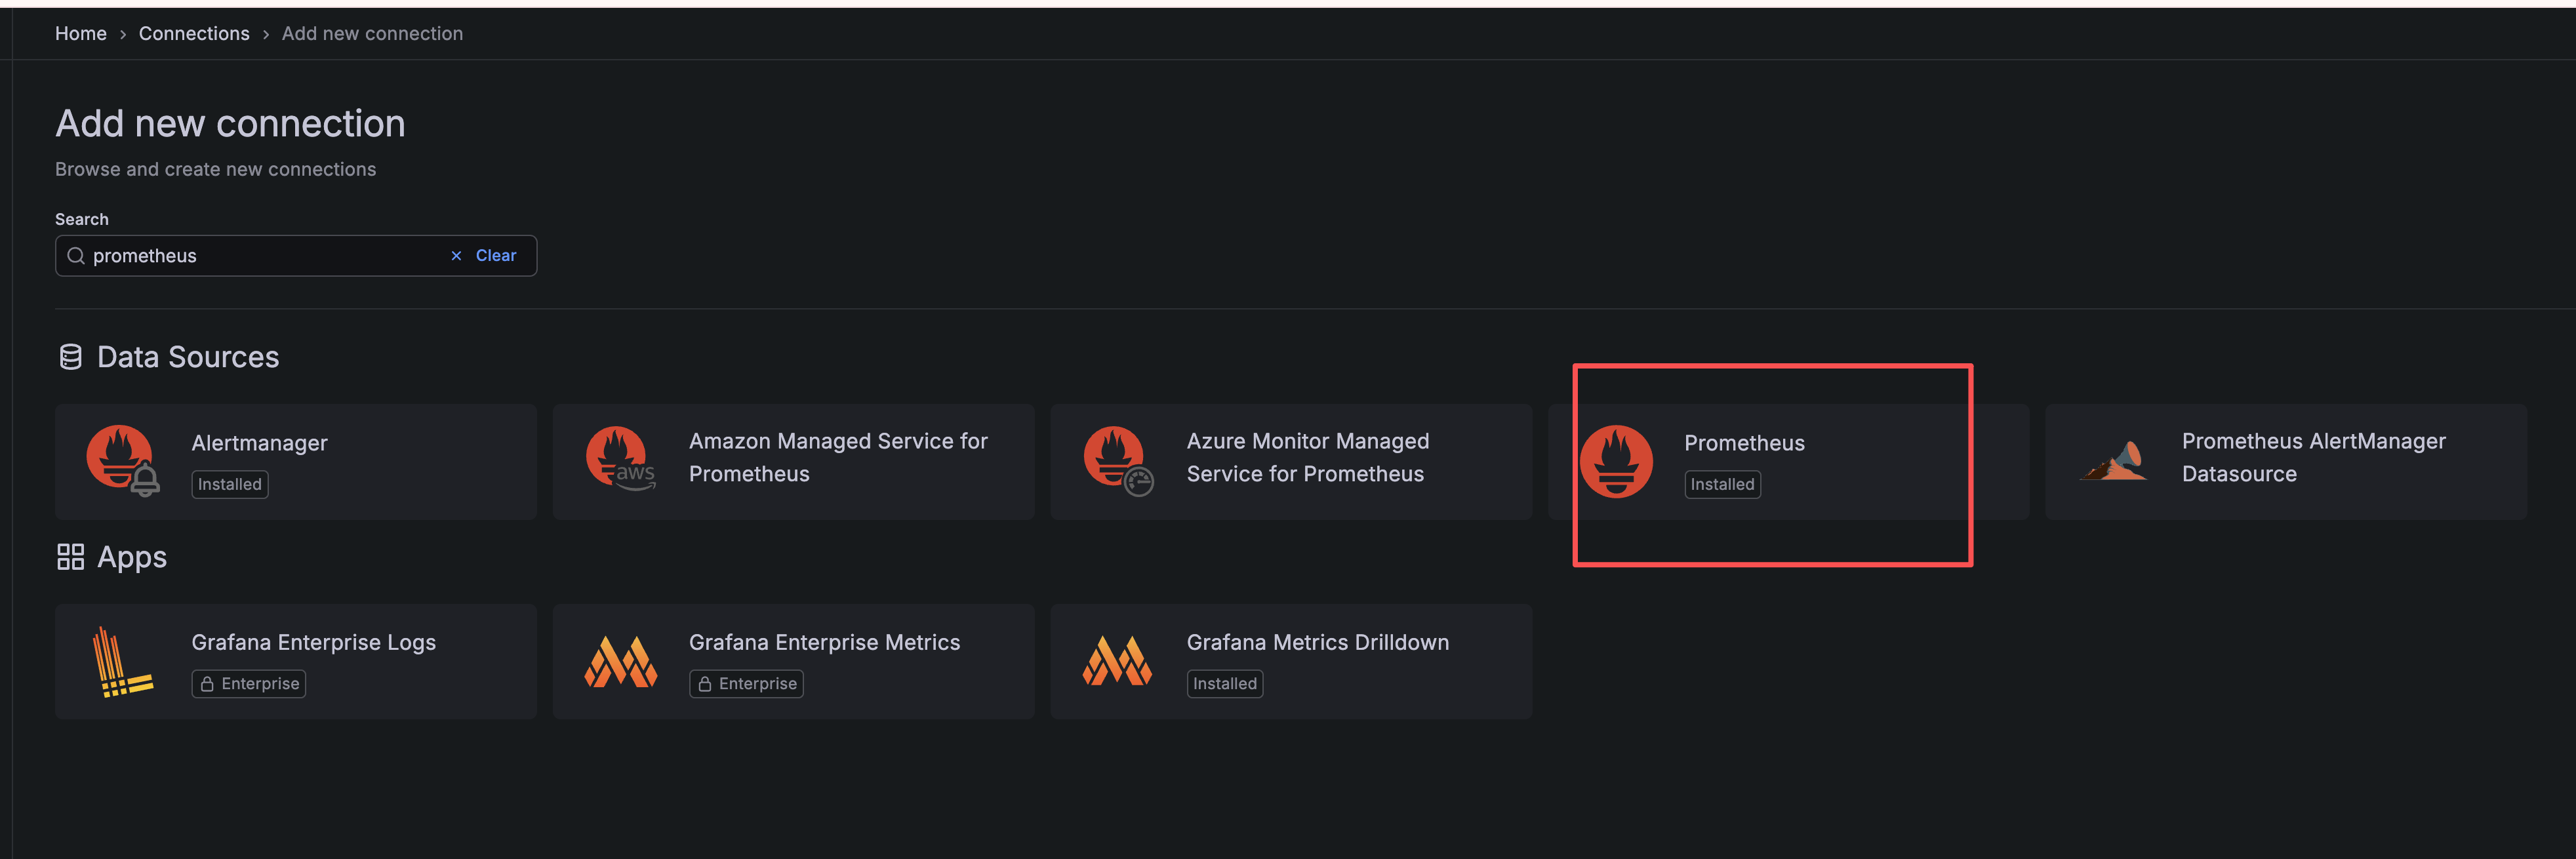
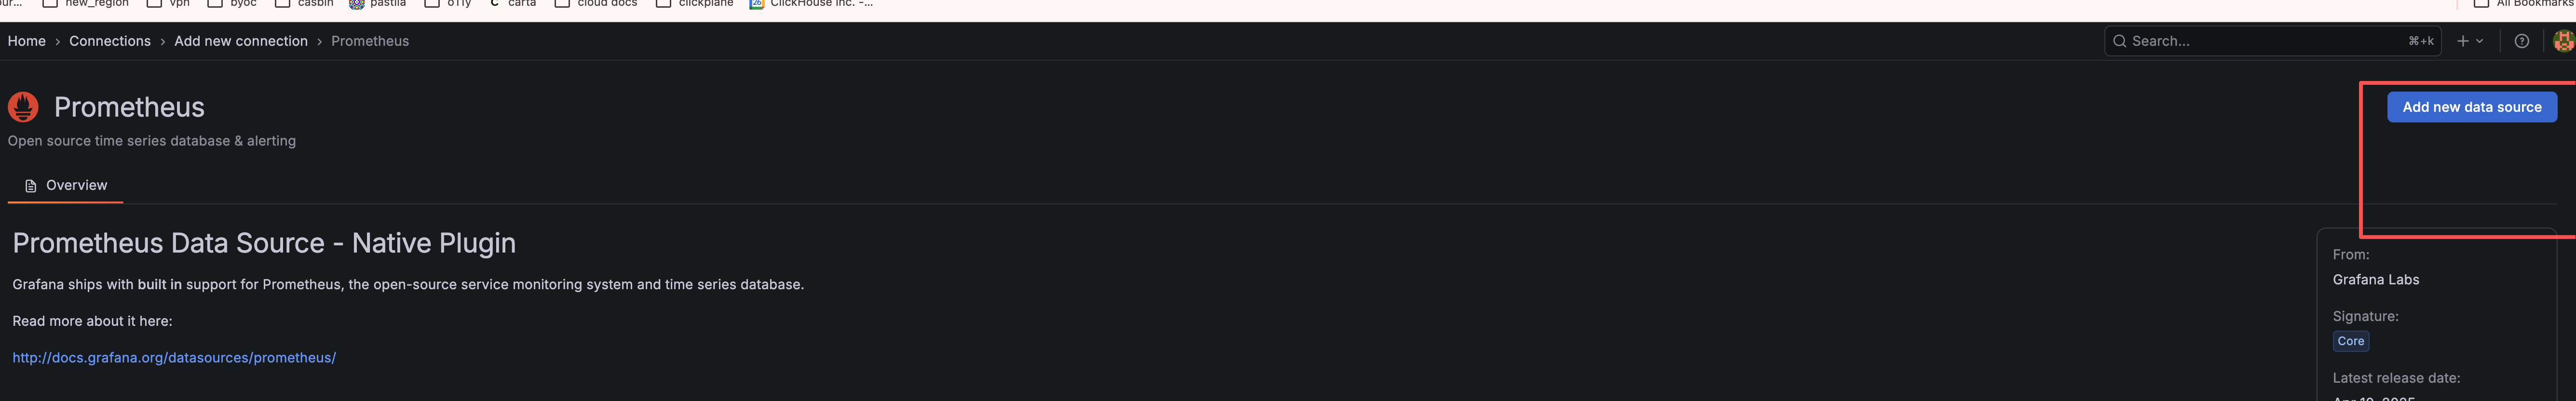
- Add Prometheus as a Data Source in Grafana
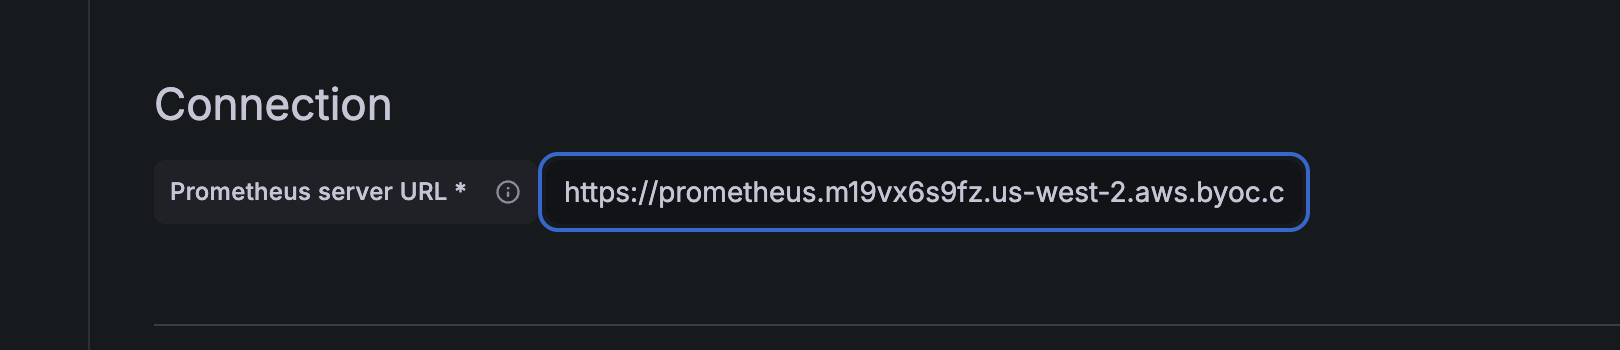
Go to "Data sources" in the Grafana sidebar, click "Add data source," and select "Prometheus." Enter your Prometheus instance URL and any required credentials to connect.
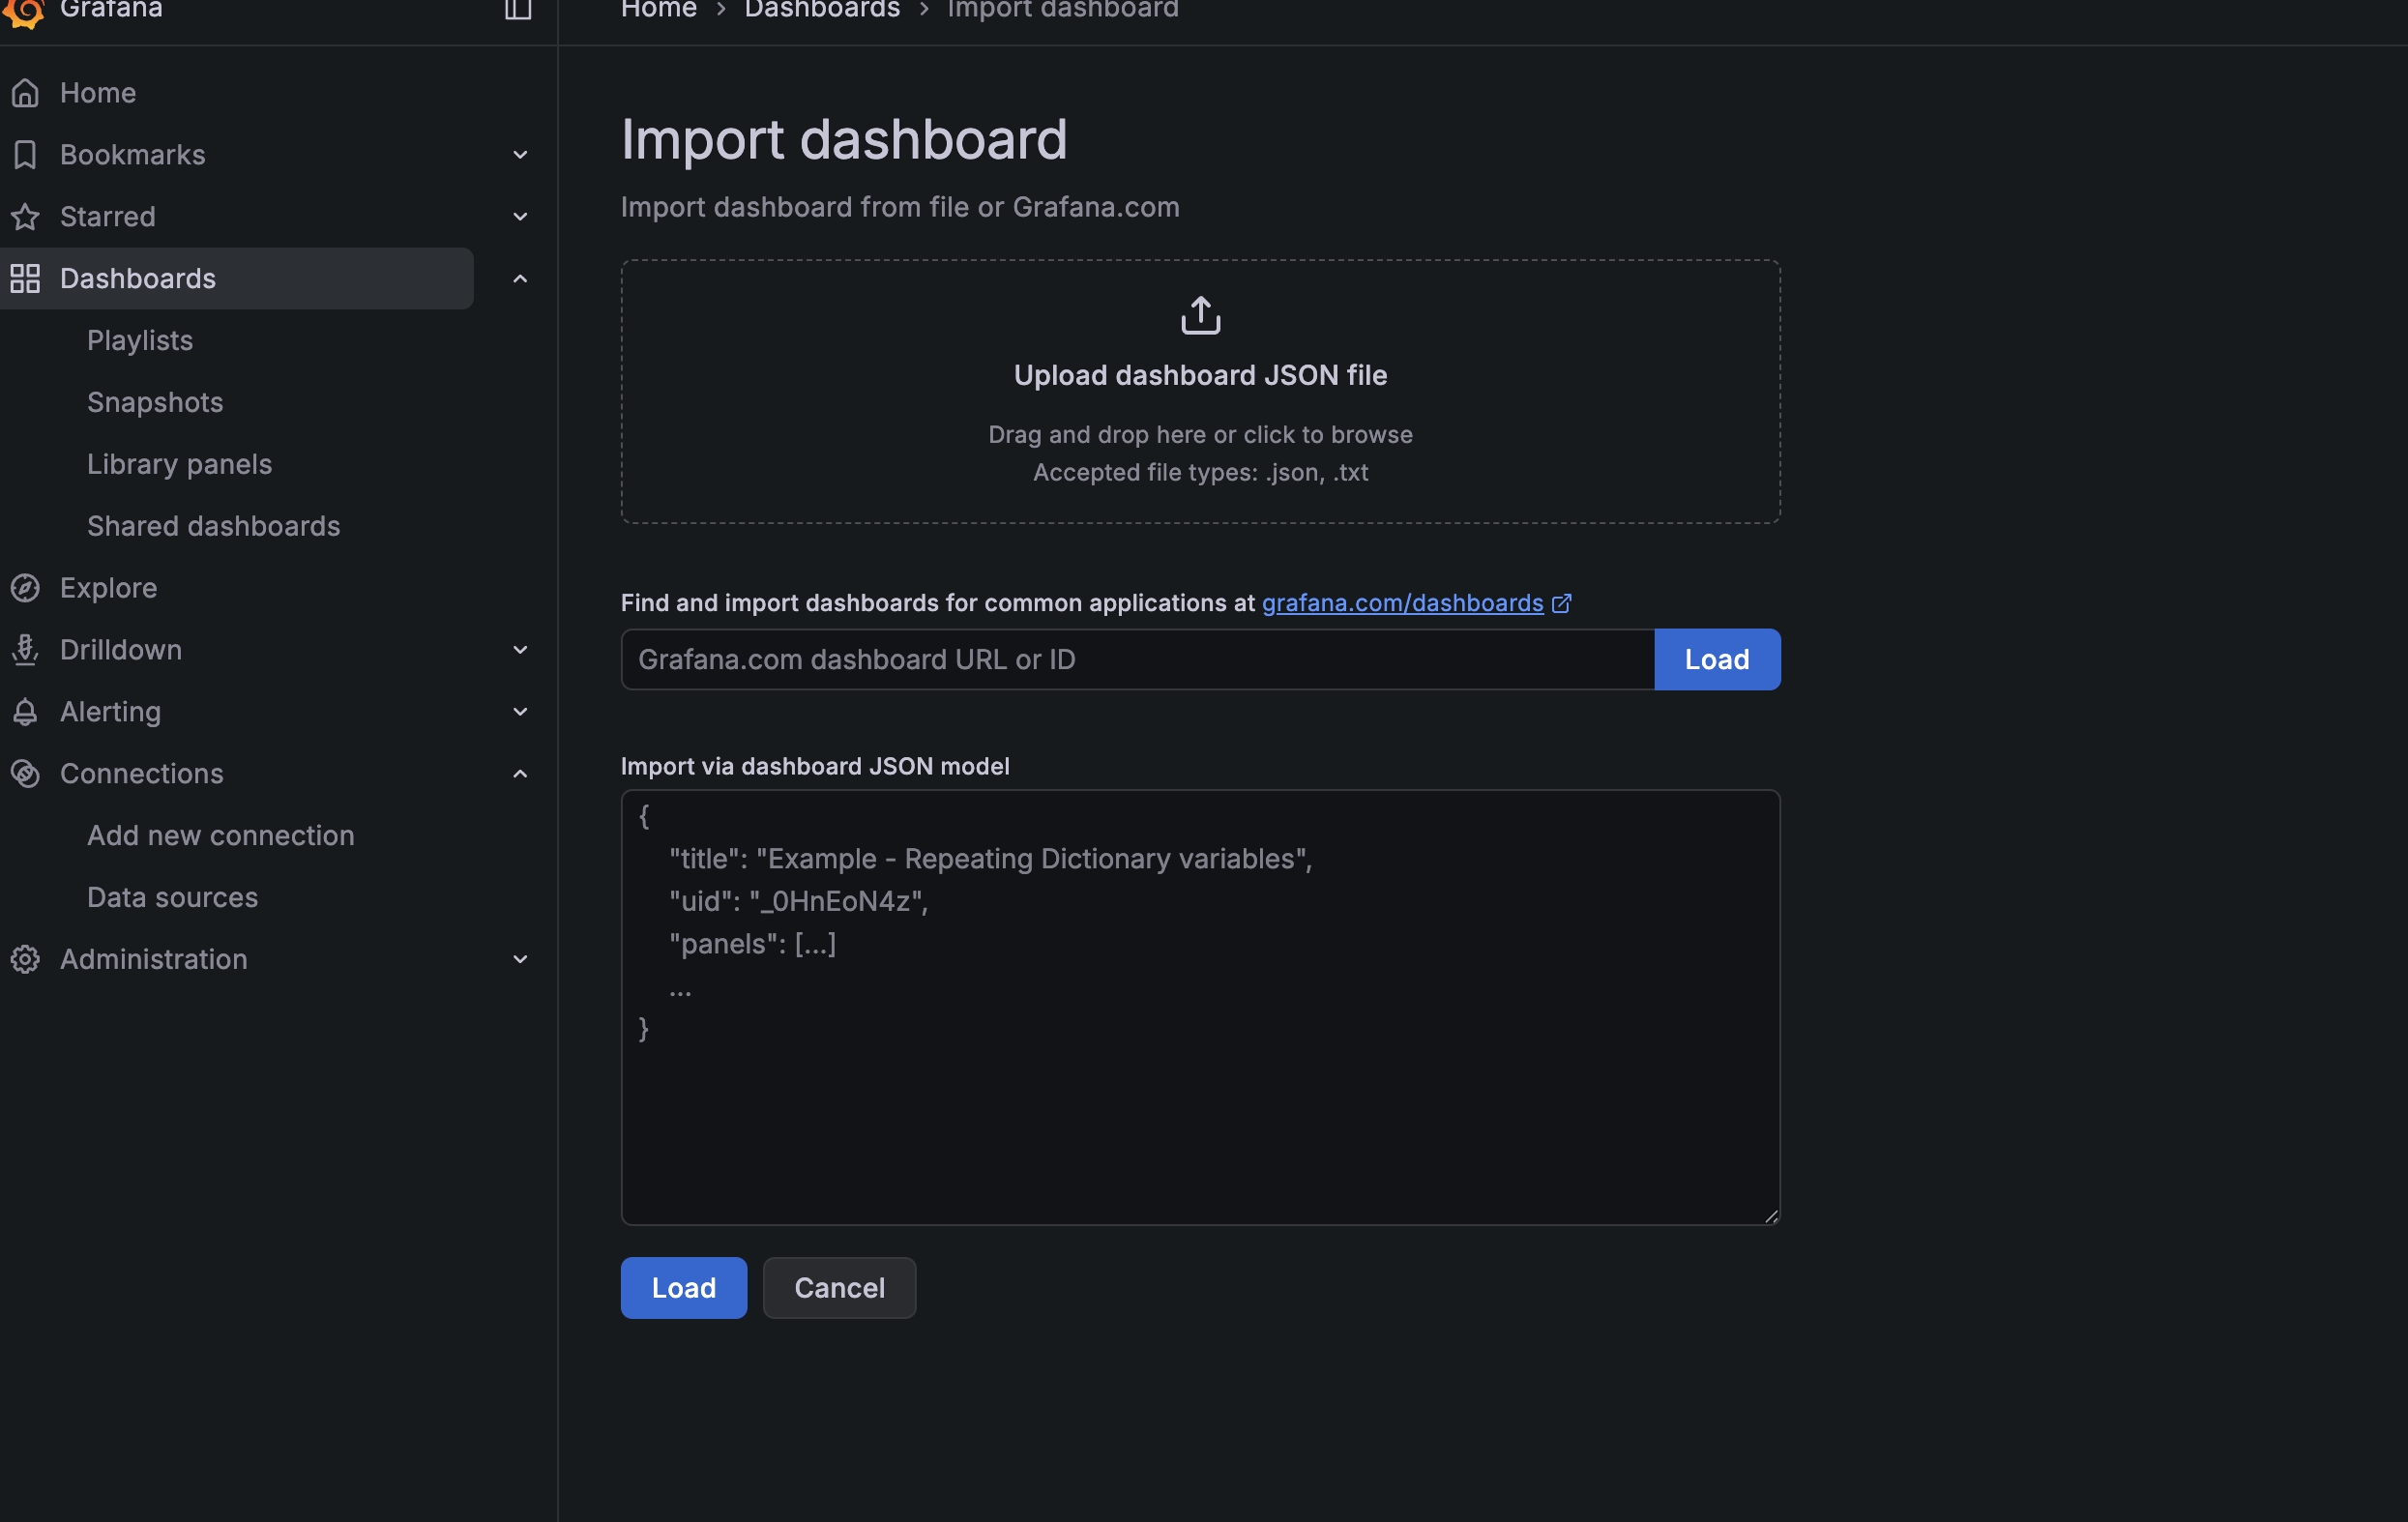
- Import the ClickHouse Dashboard
In Grafana, navigate to the dashboard area and choose "Import." You can either upload the dashboard JSON file or paste its contents directly. Obtain the JSON file from the ClickHouse mixin repository:
ClickHouse Mix-in Dashboard JSON
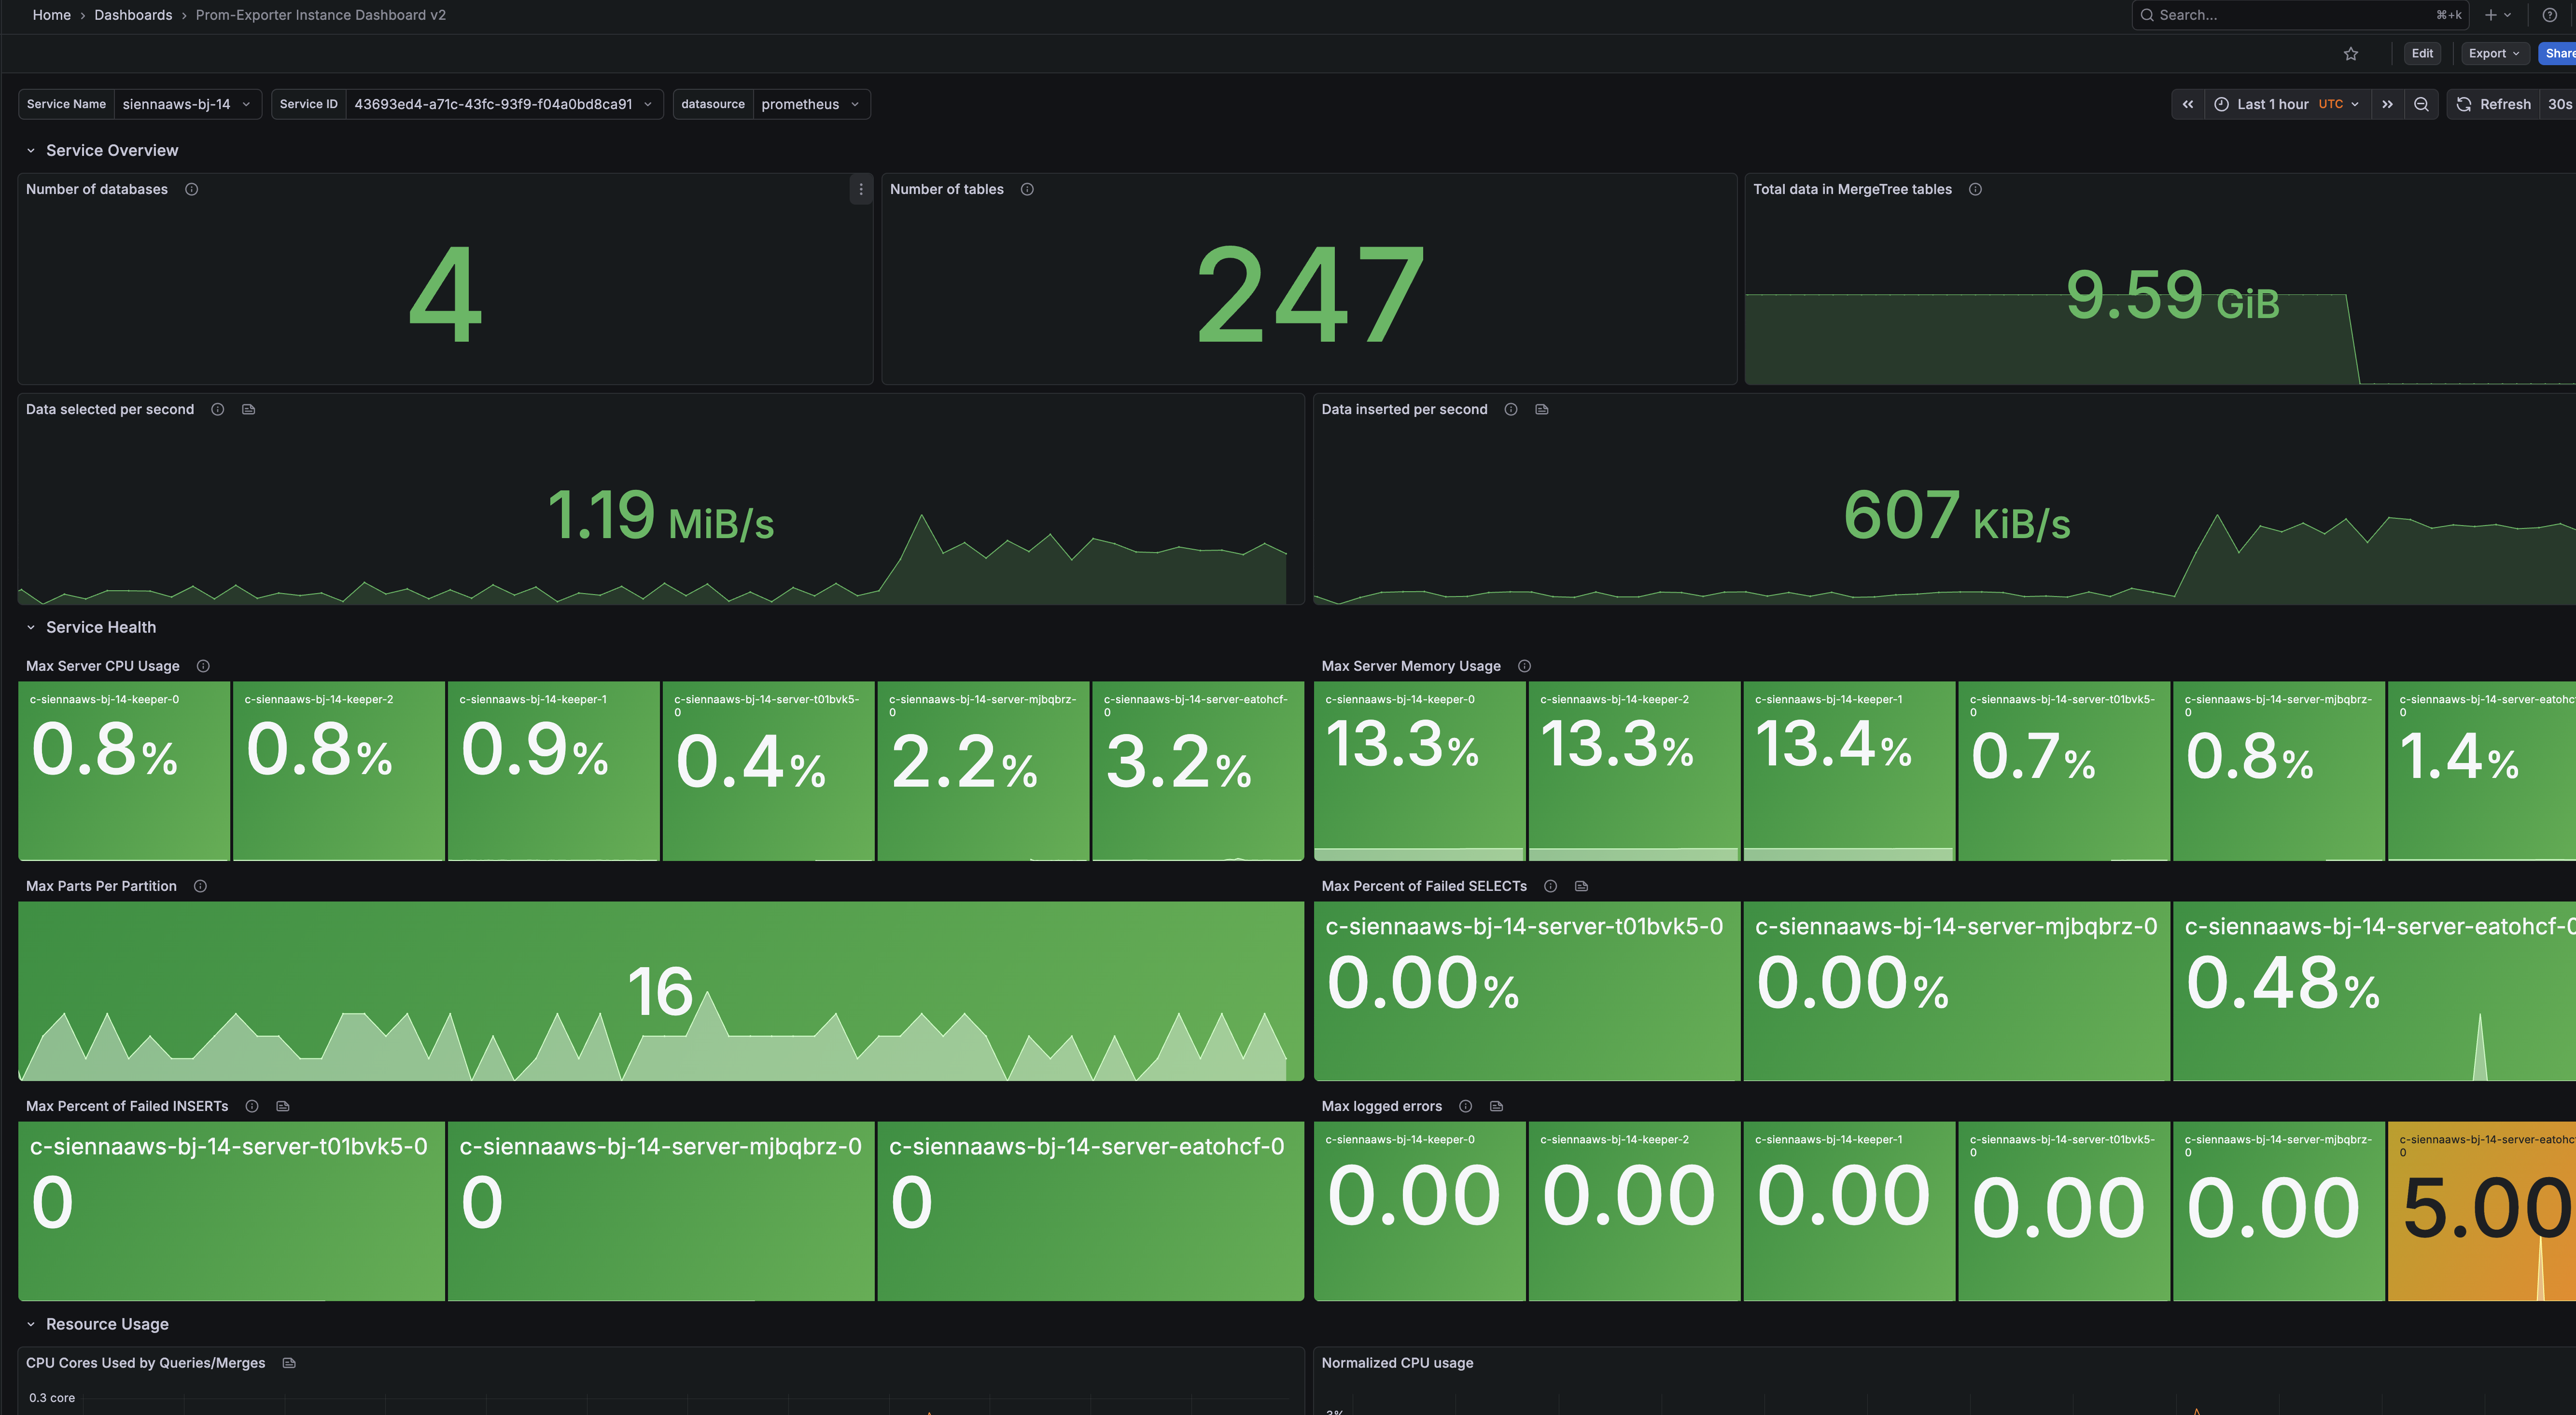
- Explore Your Metrics
Once the dashboard is imported and configured with your Prometheus data source, you should see real-time metrics from your ClickHouse Cloud services.